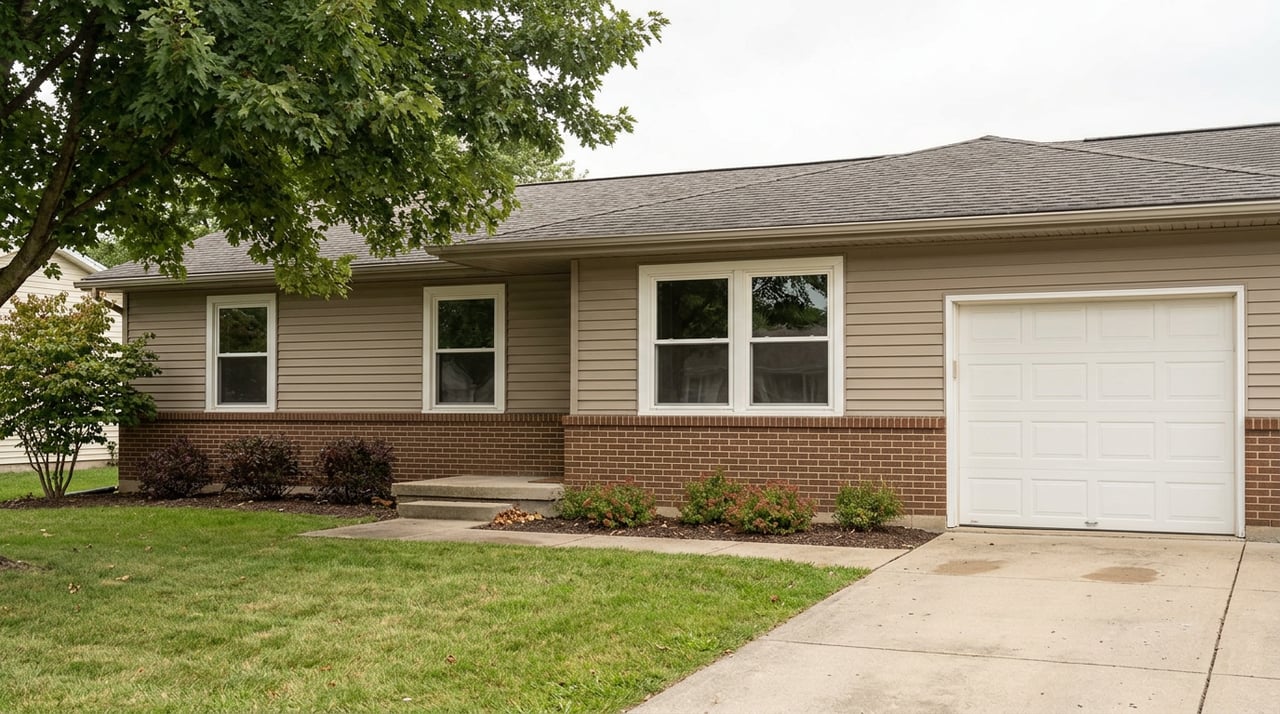
Theresa Piper and her husband bought their ranch home in Johnstown back in 2013. At the time, they figured they'd found their forever place. More than a decade later, the view from her backyard has changed. Cranes now rise above the tree line, tied to the Cologix data-center campus and the Intel project taking shape nearby. Workers leaving the construction sites funnel onto the road outside her house every day. Developers have already bought and cleared several nearby homes to make room for the data centers and the infrastructure that supports them. Piper's home was not one of them. She's said she isn't interested in leaving unless a developer makes her the same offer her neighbors got.
That backyard view is a real estate story before it's anything else, and it's the story that gets lost every time someone quotes Johnstown's median home price as proof the whole town is cashing in.
The Number Everyone Is Repeating
Here's the headline stat making the rounds: according to Columbus Realtors data reported by Spectrum News 1 in early August, the median sale price in the Johnstown-Monroe Local School District rose from $270,000 in 2020 to $425,000 in 2025. That's a real number, and it's easy to hear it and assume the Intel effect is minting equity across the whole town evenly.
The same reporting includes a caveat worth sitting with. Home prices rose across Central Ohio during that same stretch, which means the jump can't be pinned solely on data-center development. Local buyer demand, tight supply, and investor interest all played a role. So did something the school-district-level median doesn't show at all: how few homes are actually changing hands in Johnstown at any given time, and how much a single transaction can move that number.
What One Sale Can Do to a Median
This is the part that changes how you should read any Johnstown price headline. The most recent detailed monthly breakdown available, from November 2025, put Johnstown's median sale price at $405,000, up nearly 40% year over year. In that same month, the average sale price actually fell more than 20% year over year. A median jumping while an average drops in the same market, in the same month, is not a sign of broad appreciation. It's a sign that the mix of homes selling changed, not that every home in town got more valuable.
Look closer and the picture gets even more specific. That same November, price per square foot was down about 12% year over year. Days on market nearly doubled, moving from 44 days to 102. And only one home sold that month, compared to seven the year before. A market that thin doesn't produce a stable median. It produces a number that swings wildly depending on which single house happened to close, whether it was a new-construction build, a legacy farmhouse on acreage, or a starter ranch like Piper's.
Here's how those different lenses on the same market line up:
| Data Source | Time Window | Figure | What It Actually Measures |
|---|---|---|---|
| Monthly median sale price | November 2025 | $405,000, up 39.7% year over year | One month's small sample, easily skewed by a single closing |
| Price per square foot | November 2025 | $168, down 12% year over year | Value per unit of space, a steadier read on typical homes |
| Days on market | November 2025 | 102 days, up from 44 | How long typical homes are actually sitting before selling |
| Smoothed home value index | Mid-2026 | $400,364, up 5.9% year over year | A broader, less volatile measure across all homes in town |
| School-district median | 2020 to 2025 | $270,000 to $425,000 | Long-run change, but not adjusted for what's newly built vs. resold |
Put side by side, these numbers tell a calmer story than the 40% headline suggests. A smoothed index that accounts for the full range of homes in town, rather than just whichever handful closed in a given month, shows appreciation closer to 6% over the year. That's healthy. It's also nowhere near "prices are exploding," which is the read a lot of buyers walk away with after seeing the median-price headline once.
The Slower Market Hiding Under the Headline
If you're cross-shopping Johnstown against New Albany, Westerville, or Lewis Center, the days-on-market shift matters more than the price jump. A typical Johnstown listing going from 44 days to over 100 days on market in the same year the median "jumped" tells you buyers have room to negotiate that the headline number hides completely. Sellers pricing a home based on last year's fast-moving comps may be surprised when it sits. Buyers assuming they need to waive every contingency to compete in a hot Intel-adjacent market may find they have more leverage than the narrative suggests, especially outside the newest subdivisions closest to the data-center corridor.
This is also why a single town-wide median rarely tells you what you'll actually pay. Established neighborhoods away from the new construction, and newer subdivisions closer to the employment corridor, can behave like two different markets even though they share a zip code. Anyone treating "Johnstown's median" as a single number to compare against New Albany's is comparing apples to a fruit basket.
Not Every Address Gets the Same Story
Piper's situation is the clearest illustration of why median price and lived experience can diverge so sharply. Her neighbors sold to developers and moved on. She didn't get that offer, and now she lives with construction traffic and a changed view, with no price appreciation to show for it unless she eventually sells. A rising school-district median doesn't compensate an individual homeowner for construction noise, worker traffic, or the uncertainty of not knowing whether the next parcel over gets bought out next.
For buyers, this is a due-diligence point, not a reason to avoid Johnstown. If you're looking at a home near the data-center corridor or the newer developments along the Route 161 side of town, it's worth asking directly whether any adjacent parcels have pending land acquisitions, easements, or zoning changes tied to data-center or logistics expansion. It's also worth asking your agent for the actual days-on-market trend for that specific subdivision over the last 90 days, not the town-wide figure from a months-old snapshot. A home two streets from active construction and a home on the quiet, established side of town can carry very different practical realities even if they'd both get filed under the same "Johnstown" median.
Where This Leaves a Buyer Comparing Suburbs
If you're weighing Johnstown as the value alternative to New Albany, the entry point does look meaningfully lower, and the same volatility that produces Johnstown's swinging median shows up one town over too. One relocation guide citing Columbus REALTORS data for June 2026 put New Albany's median at $932,000 against Johnstown's $331,500 entry-level figure. A separate market snapshot covering public listings from late 2025 through January 2026 put New Albany's reported medians anywhere from roughly $505,000 to $720,000, depending on the source and the window. Two readings on the same town, taken months apart, land $200,000 to $400,000 apart. That's the identical thin-sample, mix-shift problem showing up in New Albany's numbers. Treat any single entry-price gap as directionally useful and treat the specific dollar figure as one month's closings, not a fixed line.
A Few Questions Worth Asking Before You Write an Offer
Is the Johnstown market actually overheated right now? Not by the smoothed numbers. A roughly 6% year-over-year gain in the broader home value index is solid, sustainable growth, not a bubble. The 40% median swing reflects a thin number of sales, not a townwide repricing.
Should I expect my Johnstown home to keep appreciating at the same rate? The safer expectation is closer to the smoothed index than the monthly median. Year-over-year swings in a market this size will keep looking dramatic on paper even when the underlying trend is steady.
What should I ask about a specific listing near the data-center corridor? Ask whether any adjacent land has pending acquisition activity, ask for that subdivision's actual days-on-market trend rather than the townwide figure, and ask whether recent comps in the immediate area are resales or new construction, since that mix changes what "comparable" really means.
Johnstown's story right now isn't that Intel turned every home into an instant windfall. It's that a small, still-growing market is producing headline numbers that move faster than the ground truth underneath them, and the buyers and sellers who read past the median are the ones making better decisions on both sides of the table.
If you're trying to make sense of what a specific Johnstown address is really worth, or how it compares to a home you're considering in New Albany, Westerville, or Lewis Center, Keys + Company can walk you through the actual comps for that street, not just the townwide headline. Request your free instant home valuation to start with real numbers instead of a data point that changes every time one house closes.